Updated 5/11/2023
In the most recent Bureau of Labor Statistics data from May 2022 covering the job market for Certified Nursing Assistants (CNAs), they reported 1,310,090 individuals employed as CNAs across the United States. That is a slight decrease from the BLS’s 2021 data when they reported 1,314,830 people employed in this role.
Despite this short-term downturn, with an aging population the number of people working as CNAs is expected to increase with the BLS projecting another 64,900 CNA jobs to be added by the year 2031.
Certified Nursing Assistants provide valuable healthcare services, typically to elderly or disabled patients at long-term-care and medical facilities while working under the supervision of a registered nurse or licensed practical nurse. CNAs assist patients with many day-to-day tasks such as feeding, grooming, monitoring vital signs, bathing, and more.
For some people, this is the first step in a career in nursing or the healthcare field, while many others are more than happy to continue working as CNAs throughout their careers, sometimes gaining different specializations that can lead to increased pay and benefits.
How much a CNA gets paid can depend on many different factors which we’ll cover in greater detail. We’ll also answer other questions such as:
- What is the average CNA salary per year?
- How much does a CNA make per hour?
- How much does a CNA make in each state?
- What are the top-paying cities for CNAs?
- How can CNAs improve their salary?
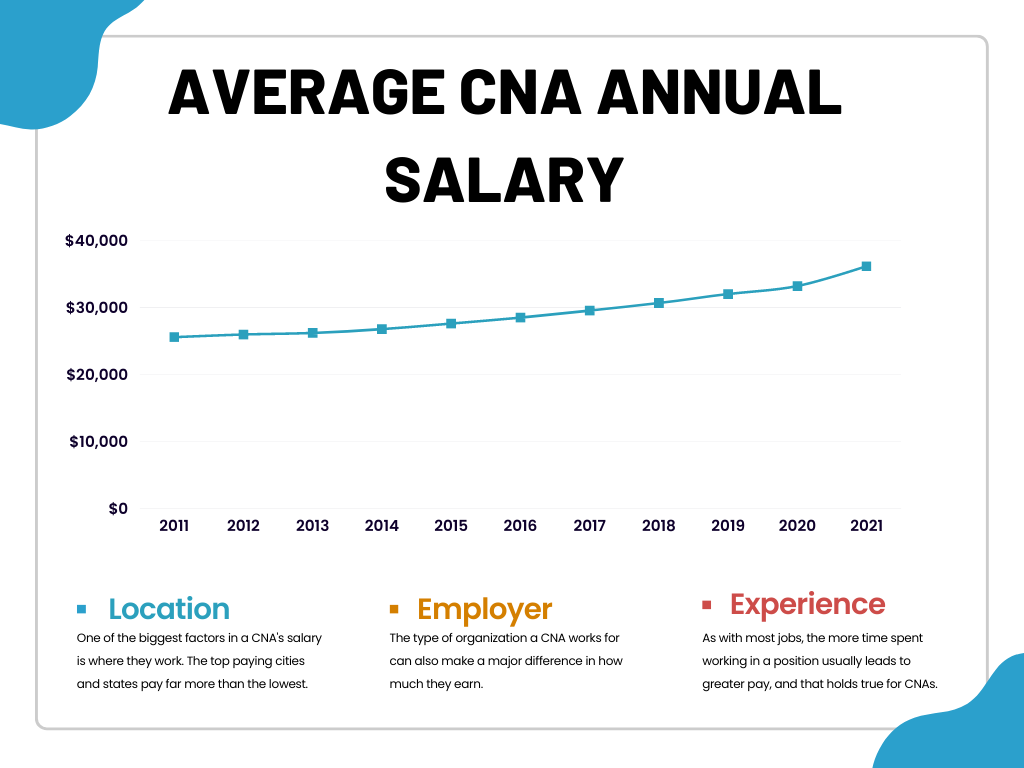
What is the average annual CNA salary?
According to the most recent Bureau of Labor Statistics most recent report from May 2022, the national average annual CNA salary was $36,220 per year in 2021, up substantially from the average of $33,250 per year in 2020. There’s been a general upward trend in the annual salary for CNAs dating back to 2011 when the average salary was $25,620. Over this time, CNA salaries have increased by $10,600 or 41.4%.
| Year | Average Salary | Hourly Rate |
|---|---|---|
| 2021 | $36,220 | $17.41 |
| 2020 | $33,250 | $15.99 |
| 2019 | $32,050 | $15.41 |
| 2018 | $30,720 | $14.77 |
| 2017 | $29,580 | $14.22 |
| 2016 | $28,540 | $13.72 |
| 2015 | $27,650 | $13.29 |
| 2014 | $26,820 | $12.89 |
| 2013 | $26,250 | $12.62 |
| 2012 | $26,020 | $12.51 |
| 2011 | $25,620 | $12.32 |
How much do CNAs make per hour?
The Bureau of Labor Statistics’ most recent report stated that the average CNA hourly salary was $17.41 up from $15.99 in 2020. It’s important to note that there are multiple data points available regarding CNA salaries beyond the BLS, all with their own data sets. The average hourly salaries for CNAs, as well as the yearly pay numbers from Indeed, Salary.com, ZipRecruiter, and Payscale can be seen below as well. Interestingly, Indeed is the only major outlier. as the rest of the salary information is quite closely aligned.
| Website | Average Annual Salary | Average Hourly Pay |
|---|---|---|
| Indeed | $44,771 | $19.82 |
| Salary.com | $33,016 | $15.87 |
| Ziprecruiter | $33,277 | $16.00 |
| Payscale | $32,827 | $15.78 |
CNA salary by state. Which states pay CNAs the most? Which states pay the least?
One of the biggest factors in how much a CNA gets paid is their location. The difference in CNA pay varies greatly from state to state. The highest paying state, on average, is Alaska at $21.35 per hour while Mississippi pays the least, coming in at only $13.05 per hour. Metro areas also tend to pay more as there are more hospitals and nursing homes, meaning the demand for workers is higher. Of course, most metro areas also have a much higher cost of living, so you’ll need to take that into account if you’re deciding between jobs.
The table below shows the average nursing assistant salary for each state. The key factors influencing pay are typically local job demand, population needs, the state government’s approach to elderly care, as well as the number and setup of various CNA employers and institutions.
| State | Average Salary | Average Hourly Wage |
|---|---|---|
| Alaska | $44,420 | $21.35 |
| District of Columbia | $43,820 | $21.07 |
| California | $43,570 | $20.95 |
| New York | $43,450 | $20.89 |
| Oregon | $42,960 | $20.65 |
| Minnesota | $42,480 | $20.42 |
| Washington | $42,430 | $20.40 |
| Massachusetts | $41,390 | $19.90 |
| Nevada | $41,110 | $19.77 |
| Hawaii | $39,870 | $19.17 |
| Rhode Island | $39,490 | $18.99 |
| New Jersey | $39,480 | $18.98 |
| Colorado | $39,050 | $18.77 |
| New Hampshire | $39,050 | $18.77 |
| Connecticut | $38,280 | $18.40 |
| North Dakota | $38,200 | $18.37 |
| Maine | $38,170 | $18.35 |
| Virgin Islands | $38,170 | $18.35 |
| Montana | $37,710 | $18.13 |
| Arizona | $37,620 | $18.09 |
| Vermont | $37,280 | $17.93 |
| Maryland | $37,180 | $17.87 |
| Illinois | $36,750 | $17.67 |
| Wisconsin | $36,750 | $17.67 |
| Delaware | $36,670 | $17.63 |
| Pennsylvania | $36,400 | $17.50 |
| Michigan | $35,960 | $17.29 |
| Wyoming | $35,720 | $17.17 |
| Idaho | $35,560 | $17.10 |
| Iowa | $35,120 | $16.89 |
| Nebraska | $35,020 | $16.84 |
| Indiana | $34,250 | $16.47 |
| Ohio | $34,110 | $16.40 |
| New Mexico | $34,090 | $16.39 |
| Kansas | $33,490 | $16.10 |
| Florida | $33,390 | $16.05 |
| Utah | $33,380 | $16.05 |
| Virginia | $33,070 | $15.90 |
| Georgia | $32,850 | $15.80 |
| Missouri | $32,760 | $15.75 |
| South Carolina | $32,490 | $15.62 |
| West Virginia | $32,470 | $15.61 |
| South Dakota | $32,330 | $15.54 |
| Kentucky | $32,180 | $15.47 |
| Texas | $32,150 | $15.46 |
| North Carolina | $31,780 | $15.28 |
| Tennessee | $31,600 | $15.19 |
| Guam | $30,590 | $14.71 |
| Oklahoma | $30,210 | $14.52 |
| Arkansas | $29,970 | $14.41 |
| Alabama | $28,550 | $13.72 |
| Louisiana | $28,190 | $13.55 |
| Mississippi | $27,140 | $13.05 |
| Puerto Rico | $23,700 | $11.40 |
Source: Bureau of Labor and Statistics
Top paying cities for CNAs
While salaries vary dramatically from state to state for nursing aides, they also diverge a lot when it comes to metro areas across the country. Below you can see the metro areas with the top average CNA salaries in the country. Even in major metro areas, the difference can be quite jarring. You can utilize the search feature to find specific cities and metro areas to see how they compare to each other and the state averages listed above.
| Metro Area | CNAs Employed | Hourly Avg. Pay | Annual Avg. Salary | 25th Percentile Annual Salary | 75th Percentile Annual Salary | Metro vs. National Avg. |
|---|---|---|---|---|---|---|
| Abilene, TX | 810 | $14.04 | $29,210 | $13.40 | $14.56 | -19.4% |
| Akron, OH | 3330 | $16.18 | $33,650 | $14.82 | $17.41 | -7.1% |
| Albany, GA | 760 | $15.74 | $32,740 | $11.23 | $16.43 | -9.6% |
| Albany, OR | 460 | $18.96 | $39,440 | $16.74 | $19.48 | 8.9% |
| Albany-Schenectady-Troy, NY | 3750 | $17.42 | $36,240 | $15.31 | $18.52 | 0.1% |
| Albuquerque, NM | 1830 | $16.74 | $34,810 | $14.64 | $17.36 | -3.9% |
| Alexandria, LA | 740 | $13.29 | $27,640 | $11.75 | $14.21 | -23.7% |
| Allentown-Bethlehem-Easton, PA-NJ | 4700 | $17.79 | $37,010 | $17.13 | $18.43 | 2.2% |
| Altoona, PA | 860 | $16.68 | $34,690 | $14.21 | $17.67 | -4.2% |
| Amarillo, TX | 1020 | $14.81 | $30,800 | $13.65 | $15.23 | -15.0% |
| Ames, IA | 470 | $16.92 | $35,190 | $16.53 | $17.61 | -2.8% |
| Anchorage, AK | 1030 | $20.50 | $42,630 | $17.79 | $21.63 | 17.7% |
| Ann Arbor, MI | 3060 | $18.36 | $38,180 | $17.30 | $18.73 | 5.4% |
| Anniston-Oxford-Jacksonville, AL | 510 | $12.45 | $25,890 | $10.85 | $13.76 | -28.5% |
| Appleton, WI | 840 | $17.20 | $35,780 | $15.53 | $18.27 | -1.2% |
| Asheville, NC | 2920 | $15.85 | $32,970 | $14.14 | $17.07 | -9.0% |
| Athens-Clarke County, GA | 630 | $14.53 | $30,210 | $12.87 | $15.65 | -16.6% |
| Atlanta-Sandy Springs-Roswell, GA | 20820 | $17.12 | $35,610 | $13.60 | $17.63 | -1.7% |
| Atlantic City-Hammonton, NJ | 1180 | $17.53 | $36,470 | $16.66 | $18.39 | 0.7% |
| Auburn-Opelika, AL | 400 | $13.69 | $28,470 | $13.00 | $14.12 | -21.4% |
| Augusta-Richmond County, GA-SC | 2720 | $14.80 | $30,790 | $12.59 | $16.52 | -15.0% |
| Austin-Round Rock, TX | 5260 | $16.17 | $33,630 | $14.63 | $17.29 | -7.2% |
| Bakersfield, CA | 1340 | $18.64 | $38,770 | $16.76 | $20.22 | 7.0% |
| Baltimore-Columbia-Towson, MD | 13700 | $17.71 | $36,830 | $15.27 | $18.91 | 1.7% |
| Bangor, ME | 950 | $18.02 | $37,480 | $15.41 | $19.16 | 3.5% |
| Barnstable Town, MA | 1170 | $19.37 | $40,290 | $17.38 | $19.91 | 11.2% |
| Baton Rouge, LA | 2790 | $14.32 | $29,790 | $12.73 | $15.00 | -17.8% |
| Battle Creek, MI | 570 | $17.88 | $37,180 | $15.37 | $19.14 | 2.7% |
| Bay City, MI | 480 | $15.70 | $32,650 | $14.52 | $17.05 | -9.9% |
| Beaumont-Port Arthur, TX | 1020 | $14.27 | $29,690 | $13.51 | $15.58 | -18.0% |
| Beckley, WV | 570 | $14.46 | $30,070 | $13.12 | $15.97 | -17.0% |
| Bellingham, WA | 690 | $19.52 | $40,610 | $17.66 | $20.90 | 12.1% |
| Bend-Redmond, OR | 410 | $20.33 | $42,280 | $18.71 | $22.45 | 16.7% |
| Billings, MT | 980 | $18.20 | $37,860 | $15.55 | $19.24 | 4.5% |
| Binghamton, NY | 1310 | $16.23 | $33,770 | $15.00 | $17.53 | -6.8% |
| Birmingham-Hoover, AL | 4900 | $14.38 | $29,900 | $13.23 | $15.49 | -17.4% |
| Bismarck, ND | 1810 | $18.24 | $37,930 | $15.66 | $19.50 | 4.7% |
| Blacksburg-Christiansburg-Radford, VA | 670 | $15.30 | $31,830 | $13.94 | $17.41 | -12.1% |
| Bloomington, IL | 740 | $16.21 | $33,720 | $15.16 | $16.56 | -6.9% |
| Bloomington, IN | 520 | $16.04 | $33,370 | $14.20 | $17.75 | -7.9% |
| Bloomsburg-Berwick, PA | 840 | $15.87 | $33,000 | $15.56 | $16.87 | -8.9% |
| Boise City, ID | 2870 | $17.88 | $37,190 | $16.00 | $18.42 | 2.7% |
| Boston-Cambridge-Nashua, MA-NH | 26140 | $20.42 | $42,480 | $18.21 | $21.68 | 17.3% |
| Boulder, CO | 930 | $19.72 | $41,020 | $18.49 | $20.93 | 13.3% |
| Bowling Green, KY | 580 | $15.08 | $31,360 | $13.33 | $16.50 | -13.4% |
| Bremerton-Silverdale, WA | 850 | $19.42 | $40,390 | $17.89 | $20.99 | 11.5% |
| Bridgeport-Stamford-Norwalk, CT | 4190 | $18.55 | $38,580 | $17.40 | $19.21 | 6.5% |
| Brownsville-Harlingen, TX | 1010 | $13.19 | $27,440 | $11.78 | $13.90 | -24.2% |
| Brunswick, GA | 460 | $14.17 | $29,470 | $12.94 | $14.62 | -18.6% |
| Buffalo-Cheektowaga-Niagara Falls, NY | 4220 | $17.32 | $36,030 | $15.28 | $19.03 | -0.5% |
| Burlington, NC | 780 | $14.97 | $31,140 | $12.84 | $17.19 | -14.0% |
| Burlington-South Burlington, VT | 1030 | $18.66 | $38,810 | $17.84 | $19.02 | 7.2% |
| California-Lexington Park, MD | 270 | $18.09 | $37,630 | $15.64 | $18.77 | 3.9% |
| Canton-Massillon, OH | 2360 | $15.75 | $32,760 | $14.14 | $16.99 | -9.6% |
| Cape Coral-Fort Myers, FL | 2650 | $16.24 | $33,780 | $14.60 | $17.25 | -6.7% |
| Cape Girardeau, MO-IL | 740 | $14.42 | $30,000 | $13.46 | $15.36 | -17.2% |
| Carbondale-Marion, IL | 680 | $16.25 | $33,800 | $14.69 | $17.88 | -6.7% |
| Carson City, NV | 240 | $19.60 | $40,780 | $17.48 | $21.44 | 12.6% |
| Casper, WY | 420 | $17.12 | $35,620 | $15.76 | $18.15 | -1.7% |
| Cedar Rapids, IA | 1500 | $17.02 | $35,400 | $16.32 | $17.54 | -2.3% |
| Chambersburg-Waynesboro, PA | 600 | $18.64 | $38,780 | $16.91 | $20.07 | 7.1% |
| Champaign-Urbana, IL | 1070 | $17.15 | $35,670 | $16.50 | $17.64 | -1.5% |
| Charleston, WV | 1130 | $14.93 | $31,060 | $13.99 | $16.52 | -14.2% |
| Charleston-North Charleston, SC | 2670 | $17.18 | $35,730 | $14.92 | $17.58 | -1.4% |
| Charlotte-Concord-Gastonia, NC-SC | 10110 | $15.93 | $33,140 | $14.19 | $17.49 | -8.5% |
| Charlottesville, VA | 1690 | $16.39 | $34,090 | $15.20 | $17.59 | -5.9% |
| Chattanooga, TN-GA | 2150 | $15.01 | $31,220 | $13.48 | $16.62 | -13.8% |
| Cheyenne, WY | 480 | $17.53 | $36,460 | $15.71 | $19.41 | 0.7% |
| Chicago-Naperville-Elgin, IL-IN-WI | 37030 | $18.37 | $38,200 | $17.43 | $18.78 | 5.5% |
| Chico, CA | 890 | $19.08 | $39,690 | $17.99 | $19.59 | 9.6% |
| Cincinnati, OH-KY-IN | 10810 | $16.53 | $34,390 | $14.76 | $17.79 | -5.1% |
| Clarksville, TN-KY | 710 | $14.53 | $30,210 | $12.83 | $16.52 | -16.6% |
| Cleveland, TN | 660 | $13.25 | $27,570 | $11.66 | $15.01 | -23.9% |
| Cleveland-Elyria, OH | 12120 | $17.21 | $35,790 | $15.90 | $18.12 | -1.2% |
| Coeur d'Alene, ID | 720 | $17.05 | $35,450 | $15.19 | $17.46 | -2.1% |
| College Station-Bryan, TX | 880 | $14.34 | $29,830 | $13.85 | $15.92 | -17.6% |
| Colorado Springs, CO | 3250 | $18.31 | $38,080 | $16.52 | $18.80 | 5.1% |
| Columbia, MO | 1330 | $15.71 | $32,670 | $14.41 | $15.79 | -9.8% |
| Columbia, SC | 3820 | $15.81 | $32,880 | $14.19 | $17.32 | -9.2% |
| Columbus, GA-AL | 980 | $13.45 | $27,980 | $11.29 | $14.09 | -22.7% |
| Columbus, OH | 9410 | $16.67 | $34,680 | $14.88 | $17.72 | -4.3% |
| Corpus Christi, TX | 1430 | $14.82 | $30,830 | $13.78 | $15.65 | -14.9% |
| Corvallis, OR | 330 | $18.84 | $39,190 | $17.61 | $19.51 | 8.2% |
| Crestview-Fort Walton Beach-Destin, FL | 770 | $15.62 | $32,490 | $14.15 | $16.85 | -10.3% |
| Cumberland, MD-WV | 500 | $15.53 | $32,290 | $14.50 | $16.98 | -10.9% |
| Dallas-Fort Worth-Arlington, TX | 21940 | $16.34 | $34,000 | $14.58 | $17.56 | -6.1% |
| Dalton, GA | 390 | $14.95 | $31,090 | $13.81 | $16.62 | -14.2% |
| Danbury, CT | 770 | $18.52 | $38,520 | $17.00 | $19.79 | 6.4% |
| Danville, IL | 360 | $17.67 | $36,750 | $15.20 | $19.67 | 1.5% |
| Daphne-Fairhope-Foley, AL | 580 | $13.79 | $28,680 | $12.55 | $14.37 | -20.8% |
| Davenport-Moline-Rock Island, IA-IL | 1990 | $16.26 | $33,820 | $14.68 | $17.30 | -6.6% |
| Dayton, OH | 4120 | $16.36 | $34,030 | $14.76 | $17.47 | -6.0% |
| Decatur, AL | 270 | $14.34 | $29,820 | $13.70 | $14.86 | -17.7% |
| Decatur, IL | 570 | $17.02 | $35,400 | $14.80 | $17.15 | -2.3% |
| Deltona-Daytona Beach-Ormond Beach, FL | 2650 | $14.80 | $30,790 | $13.82 | $16.27 | -15.0% |
| Denver-Aurora-Lakewood, CO | 10990 | $19.35 | $40,250 | $17.82 | $20.42 | 11.1% |
| Des Moines-West Des Moines, IA | 3960 | $17.50 | $36,400 | $15.55 | $18.19 | 0.5% |
| Detroit-Warren-Dearborn, MI | 16330 | $17.53 | $36,460 | $16.54 | $18.48 | 0.7% |
| Dothan, AL | 840 | $12.30 | $25,580 | $10.86 | $12.74 | -29.4% |
| Dover, DE | 890 | $16.84 | $35,020 | $15.28 | $18.60 | -3.3% |
| Dover-Durham, NH-ME | 610 | $18.13 | $37,710 | $17.47 | $18.83 | 4.1% |
| Dubuque, IA | 840 | $16.88 | $35,120 | $15.45 | $17.57 | -3.0% |
| Duluth, MN-WI | 1710 | $18.35 | $38,170 | $16.78 | $20.56 | 5.4% |
| Durham-Chapel Hill, NC | 4640 | $16.82 | $34,980 | $15.31 | $18.37 | -3.4% |
| East Stroudsburg, PA | 350 | $16.46 | $34,230 | $16.49 | $17.06 | -5.5% |
| Eau Claire, WI | 760 | $17.16 | $35,680 | $15.19 | $17.85 | -1.5% |
| El Centro, CA | 200 | $17.94 | $37,310 | $16.39 | $19.38 | 3.0% |
| El Paso, TX | 2030 | $13.69 | $28,470 | $11.97 | $14.53 | -21.4% |
| Elizabethtown-Fort Knox, KY | 380 | $15.01 | $31,220 | $13.67 | $16.47 | -13.8% |
| Elkhart-Goshen, IN | 860 | $16.64 | $34,610 | $15.04 | $17.69 | -4.4% |
| Elmira, NY | 450 | $16.57 | $34,470 | $15.46 | $19.05 | -4.8% |
| Enid, OK | 360 | $13.82 | $28,750 | $13.00 | $14.19 | -20.6% |
| Erie, PA | 1700 | $16.47 | $34,250 | $14.95 | $17.52 | -5.4% |
| Eugene, OR | 1260 | $19.40 | $40,360 | $17.34 | $21.91 | 11.4% |
| Evansville, IN-KY | 1790 | $16.09 | $33,460 | $14.19 | $17.13 | -7.6% |
| Fargo, ND-MN | 2430 | $17.94 | $37,310 | $15.56 | $19.05 | 3.0% |
| Farmington, NM | 350 | $16.40 | $34,110 | $14.20 | $17.36 | -5.8% |
| Fayetteville, NC | 1770 | $14.46 | $30,080 | $12.33 | $16.66 | -17.0% |
| Fayetteville-Springdale-Rogers, AR-MO | 2170 | $15.18 | $31,580 | $13.91 | $16.74 | -12.8% |
| Flagstaff, AZ | 370 | $18.02 | $37,480 | $17.62 | $17.93 | 3.5% |
| Flint, MI | 1250 | $17.33 | $36,040 | $15.24 | $19.09 | -0.5% |
| Florence, SC | 1170 | $14.14 | $29,410 | $12.34 | $16.03 | -18.8% |
| Florence-Muscle Shoals, AL | 540 | $13.02 | $27,090 | $11.18 | $13.84 | -25.2% |
| Fond du Lac, WI | 470 | $17.37 | $36,130 | $16.07 | $19.43 | -0.2% |
| Fort Collins, CO | 1480 | $18.30 | $38,060 | $16.41 | $19.71 | 5.1% |
| Fort Smith, AR-OK | 1480 | $14.24 | $29,630 | $13.44 | $15.46 | -18.2% |
| Fort Wayne, IN | 2430 | $15.77 | $32,800 | $14.33 | $17.63 | -9.4% |
| Fresno, CA | 2550 | $18.38 | $38,240 | $16.95 | $19.10 | 5.6% |
| Gadsden, AL | 530 | $12.87 | $26,770 | $10.94 | $14.07 | -26.1% |
| Gainesville, FL | 2610 | $16.56 | $34,430 | $14.75 | $17.44 | -4.9% |
| Gainesville, GA | 1060 | $15.18 | $31,580 | $13.91 | $16.71 | -12.8% |
| Gettysburg, PA | 410 | $17.14 | $35,650 | $15.32 | $17.96 | -1.6% |
| Glens Falls, NY | 550 | $17.79 | $37,010 | $15.22 | $19.94 | 2.2% |
| Goldsboro, NC | 1250 | $15.31 | $31,850 | $15.31 | $15.70 | -12.1% |
| Grand Forks, ND-MN | 1090 | $18.41 | $38,280 | $17.42 | $19.43 | 5.7% |
| Grand Island, NE | 570 | $16.93 | $35,210 | $15.00 | $17.90 | -2.8% |
| Grand Junction, CO | 630 | $17.13 | $35,630 | $15.76 | $18.61 | -1.6% |
| Grand Rapids-Wyoming, MI | 5530 | $17.03 | $35,420 | $15.79 | $17.67 | -2.2% |
| Grants Pass, OR | 360 | $20.36 | $42,350 | $18.30 | $22.65 | 16.9% |
| Great Falls, MT | 460 | $17.03 | $35,420 | $15.55 | $18.24 | -2.2% |
| Greeley, CO | 480 | $17.60 | $36,600 | $16.82 | $18.10 | 1.0% |
| Green Bay, WI | 1500 | $17.41 | $36,200 | $16.15 | $18.19 | -0.1% |
| Greensboro-High Point, NC | 4150 | $14.93 | $31,050 | $13.40 | $16.68 | -14.3% |
| Greenville, NC | 1640 | $15.31 | $31,840 | $13.70 | $16.77 | -12.1% |
| Greenville-Anderson-Mauldin, SC | 3450 | $15.81 | $32,890 | $14.12 | $16.80 | -9.2% |
| Gulfport-Biloxi-Pascagoula, MS | 970 | $14.23 | $29,590 | $11.82 | $15.50 | -18.3% |
| Hagerstown-Martinsburg, MD-WV | 1110 | $17.13 | $35,630 | $14.44 | $19.40 | -1.6% |
| Hammond, LA | 550 | $14.19 | $29,520 | $12.31 | $14.20 | -18.5% |
| Hanford-Corcoran, CA | 240 | $17.87 | $37,180 | $17.44 | $18.36 | 2.7% |
| Harrisburg-Carlisle, PA | 3870 | $17.48 | $36,350 | $16.90 | $18.34 | 0.4% |
| Harrisonburg, VA | 710 | $15.60 | $32,450 | $14.32 | $16.79 | -10.4% |
| Hartford-West Hartford-East Hartford, CT | 7020 | $18.42 | $38,320 | $16.67 | $18.77 | 5.8% |
| Hattiesburg, MS | 390 | $12.97 | $26,990 | $10.75 | $14.07 | -25.5% |
| Hickory-Lenoir-Morganton, NC | 2820 | $15.23 | $31,680 | $13.45 | $17.63 | -12.5% |
| Hilton Head Island-Bluffton-Beaufort, SC | 680 | $15.69 | $32,630 | $13.98 | $16.83 | -9.9% |
| Hinesville, GA | 120 | $13.70 | $28,490 | $10.89 | $14.77 | -21.3% |
| Homosassa Springs, FL | 660 | $14.33 | $29,800 | $13.49 | $15.65 | -17.7% |
| Hot Springs, AR | 790 | $13.77 | $28,640 | $12.89 | $14.04 | -20.9% |
| Houma-Thibodaux, LA | 470 | $12.59 | $26,190 | $10.97 | $13.85 | -27.7% |
| Houston-The Woodlands-Sugar Land, TX | 16990 | $16.18 | $33,660 | $14.52 | $17.45 | -7.1% |
| Huntington-Ashland, WV-KY-OH | 1590 | $15.70 | $32,650 | $14.12 | $17.38 | -9.9% |
| Huntsville, AL | 1740 | $14.59 | $30,350 | $13.52 | $16.79 | -16.2% |
| Idaho Falls, ID | 420 | $15.50 | $32,240 | $14.49 | $16.50 | -11.0% |
| Indianapolis-Carmel-Anderson, IN | 9110 | $16.97 | $35,310 | $14.99 | $18.00 | -2.5% |
| Iowa City, IA | 1230 | $17.11 | $35,580 | $15.41 | $17.75 | -1.8% |
| Ithaca, NY | 340 | $17.45 | $36,290 | $15.41 | $18.46 | 0.2% |
| Jackson, MI | 550 | $17.57 | $36,550 | $17.01 | $18.89 | 0.9% |
| Jackson, MS | 2560 | $13.12 | $27,280 | $10.38 | $14.72 | -24.7% |
| Jackson, TN | 760 | $14.19 | $29,520 | $12.95 | $14.76 | -18.5% |
| Jacksonville, FL | 6810 | $15.99 | $33,250 | $14.46 | $17.58 | -8.2% |
| Jacksonville, NC | 400 | $13.55 | $28,190 | $12.35 | $14.77 | -22.2% |
| Janesville-Beloit, WI | 570 | $16.99 | $35,330 | $15.09 | $18.04 | -2.5% |
| Jefferson City, MO | 630 | $15.27 | $31,760 | $13.91 | $16.35 | -12.3% |
| Johnson City, TN | 1090 | $15.44 | $32,120 | $13.99 | $16.65 | -11.3% |
| Johnstown, PA | 490 | $14.94 | $31,070 | $14.19 | $16.08 | -14.2% |
| Jonesboro, AR | 810 | $14.56 | $30,270 | $13.47 | $15.18 | -16.4% |
| Joplin, MO | 930 | $15.08 | $31,360 | $13.90 | $15.84 | -13.4% |
| Kahului-Wailuku-Lahaina, HI | 340 | $18.12 | $37,690 | $16.19 | $17.68 | 4.1% |
| Kalamazoo-Portage, MI | 990 | $16.97 | $35,290 | $15.11 | $17.81 | -2.6% |
| Kankakee, IL | 650 | $18.39 | $38,250 | $16.27 | $19.46 | 5.6% |
| Kansas City, MO-KS | 11630 | $17.33 | $36,050 | $15.22 | $18.51 | -0.5% |
| Kennewick-Richland, WA | 940 | $17.96 | $37,350 | $15.35 | $18.95 | 3.1% |
| Killeen-Temple, TX | 1440 | $14.79 | $30,770 | $13.57 | $16.72 | -15.0% |
| Kingsport-Bristol-Bristol, TN-VA | 1280 | $14.89 | $30,980 | $13.47 | $16.43 | -14.5% |
| Kingston, NY | 360 | $17.75 | $36,910 | $16.94 | $19.13 | 1.9% |
| Knoxville, TN | 3250 | $14.44 | $30,040 | $12.78 | $15.81 | -17.1% |
| Kokomo, IN | 420 | $16.50 | $34,320 | $14.19 | $17.78 | -5.2% |
| La Crosse-Onalaska, WI-MN | 940 | $17.49 | $36,370 | $17.10 | $18.46 | 0.4% |
| Lafayette, LA | 1660 | $12.92 | $26,870 | $11.15 | $13.94 | -25.8% |
| Lafayette-West Lafayette, IN | 890 | $17.02 | $35,390 | $16.29 | $18.15 | -2.3% |
| Lake Charles, LA | 690 | $13.54 | $28,160 | $12.00 | $15.34 | -22.3% |
| Lake Havasu City-Kingman, AZ | 410 | $16.92 | $35,190 | $14.80 | $17.80 | -2.8% |
| Lakeland-Winter Haven, FL | 2360 | $15.29 | $31,790 | $14.27 | $16.40 | -12.2% |
| Lancaster, PA | 3100 | $17.34 | $36,060 | $16.77 | $18.14 | -0.4% |
| Lansing-East Lansing, MI | 1400 | $17.18 | $35,740 | $16.18 | $18.06 | -1.3% |
| Laredo, TX | 670 | $13.32 | $27,700 | $12.08 | $14.13 | -23.5% |
| Las Cruces, NM | 420 | $14.84 | $30,870 | $13.54 | $16.23 | -14.8% |
| Las Vegas-Henderson-Paradise, NV | 5630 | $19.90 | $41,400 | $16.63 | $21.91 | 14.3% |
| Lawrence, KS | 480 | $15.58 | $32,400 | $14.10 | $17.08 | -10.5% |
| Lawton, OK | 370 | $13.70 | $28,500 | $13.14 | $14.16 | -21.3% |
| Lebanon, PA | 640 | $17.38 | $36,140 | $16.61 | $18.26 | -0.2% |
| Leominster-Gardner, MA | 680 | $17.98 | $37,400 | $17.14 | $18.41 | 3.3% |
| Lewiston, ID-WA | 370 | $17.08 | $35,530 | $15.28 | $18.47 | -1.9% |
| Lewiston-Auburn, ME | 670 | $17.98 | $37,390 | $15.50 | $19.41 | 3.2% |
| Lexington-Fayette, KY | 2910 | $16.43 | $34,180 | $15.03 | $17.24 | -5.6% |
| Lima, OH | 590 | $15.02 | $31,250 | $13.94 | $16.72 | -13.7% |
| Lincoln, NE | 2220 | $16.53 | $34,380 | $14.86 | $17.91 | -5.1% |
| Little Rock-North Little Rock-Conway, AR | 4480 | $15.09 | $31,390 | $13.93 | $16.39 | -13.3% |
| Logan, UT-ID | 680 | $14.27 | $29,680 | $12.82 | $15.24 | -18.1% |
| Longview, TX | 820 | $13.84 | $28,790 | $12.63 | $14.65 | -20.5% |
| Longview, WA | 490 | $19.30 | $40,140 | $18.01 | $20.45 | 10.8% |
| Los Angeles-Long Beach-Anaheim, CA | 39710 | $20.49 | $42,620 | $18.08 | $22.00 | 17.7% |
| Louisville/Jefferson County, KY-IN | 5750 | $16.62 | $34,580 | $14.88 | $17.50 | -4.5% |
| Lubbock, TX | 1330 | $14.40 | $29,950 | $13.36 | $15.09 | -17.3% |
| Lynchburg, VA | 1010 | $14.93 | $31,060 | $13.74 | $17.19 | -14.2% |
| Macon, GA | 1520 | $14.46 | $30,090 | $12.89 | $15.48 | -16.9% |
| Madera, CA | 470 | $20.40 | $42,440 | $17.97 | $20.83 | 17.2% |
| Madison, WI | 2920 | $18.71 | $38,910 | $17.48 | $19.38 | 7.4% |
| Manchester, NH | 1310 | $18.40 | $38,270 | $16.05 | $20.33 | 5.7% |
| Manhattan, KS | 490 | $15.67 | $32,590 | $14.25 | $16.72 | -10.0% |
| Mankato-North Mankato, MN | 600 | $17.93 | $37,290 | $16.18 | $18.50 | 3.0% |
| Mansfield, OH | 460 | $14.90 | $30,980 | $13.74 | $16.72 | -14.5% |
| McAllen-Edinburg-Mission, TX | 1790 | $13.26 | $27,580 | $11.94 | $14.00 | -23.9% |
| Medford, OR | 840 | $19.70 | $40,970 | $18.25 | $21.50 | 13.1% |
| Memphis, TN-MS-AR | 3990 | $15.59 | $32,430 | $14.04 | $17.36 | -10.5% |
| Merced, CA | 380 | $18.66 | $38,810 | $17.59 | $19.09 | 7.2% |
| Miami-Fort Lauderdale-West Palm Beach, FL | 22600 | $16.17 | $33,640 | $14.05 | $17.56 | -7.1% |
| Michigan City-La Porte, IN | 310 | $15.65 | $32,550 | $13.79 | $17.04 | -10.1% |
| Midland, MI | 430 | $16.35 | $34,010 | $14.54 | $17.80 | -6.1% |
| Midland, TX | 390 | $16.60 | $34,530 | $14.86 | $17.37 | -4.7% |
| Milwaukee-Waukesha-West Allis, WI | 8410 | $17.93 | $37,290 | $15.93 | $18.99 | 3.0% |
| Minneapolis-St. Paul-Bloomington, MN-WI | 13820 | $22.36 | $46,520 | $18.22 | $22.77 | 28.4% |
| Missoula, MT | 510 | $17.88 | $37,190 | $14.95 | $20.38 | 2.7% |
| Mobile, AL | 1850 | $13.50 | $28,090 | $12.40 | $13.87 | -22.4% |
| Modesto, CA | 1560 | $19.74 | $41,060 | $17.78 | $21.37 | 13.4% |
| Monroe, LA | 1220 | $12.30 | $25,570 | $10.87 | $13.95 | -29.4% |
| Monroe, MI | 370 | $17.10 | $35,560 | $15.05 | $18.13 | -1.8% |
| Montgomery, AL | 1580 | $13.44 | $27,960 | $12.01 | $14.59 | -22.8% |
| Morgantown, WV | 1220 | $16.27 | $33,840 | $15.16 | $16.62 | -6.6% |
| Morristown, TN | 310 | $15.02 | $31,230 | $14.03 | $17.00 | -13.8% |
| Mount Vernon-Anacortes, WA | 410 | $19.80 | $41,190 | $18.29 | $21.84 | 13.7% |
| Muncie, IN | 710 | $15.84 | $32,950 | $13.81 | $17.05 | -9.0% |
| Muskegon, MI | 640 | $16.94 | $35,230 | $14.62 | $18.52 | -2.7% |
| Myrtle Beach-Conway-North Myrtle Beach, SC-NC | 1170 | $14.70 | $30,570 | $13.44 | $16.34 | -15.6% |
| Napa, CA | 530 | $21.24 | $44,180 | $19.06 | $21.28 | 22.0% |
| Naples-Immokalee-Marco Island, FL | 1600 | $16.73 | $34,790 | $15.08 | $17.54 | -3.9% |
| Nashville-Davidson--Murfreesboro--Franklin, TN | 7260 | $16.08 | $33,450 | $14.39 | $17.55 | -7.6% |
| New Bedford, MA | 850 | $18.38 | $38,230 | $17.02 | $18.19 | 5.5% |
| New Bern, NC | 720 | $13.57 | $28,230 | $11.82 | $14.75 | -22.1% |
| New Haven, CT | 4440 | $18.43 | $38,330 | $17.21 | $19.59 | 5.8% |
| New Orleans-Metairie, LA | 3870 | $14.49 | $30,150 | $12.81 | $15.32 | -16.8% |
| New York-Newark-Jersey City, NY-NJ-PA | 79570 | $21.50 | $44,720 | $18.69 | $23.69 | 23.5% |
| Niles-Benton Harbor, MI | 520 | $16.57 | $34,460 | $14.87 | $17.47 | -4.9% |
| North Port-Sarasota-Bradenton, FL | 3450 | $16.01 | $33,310 | $14.13 | $17.36 | -8.0% |
| Norwich-New London-Westerly, CT-RI | 1060 | $19.12 | $39,780 | $17.02 | $21.76 | 9.8% |
| Ocala, FL | 1360 | $14.78 | $30,740 | $13.61 | $16.37 | -15.1% |
| Ocean City, NJ | 320 | $17.50 | $36,390 | $15.59 | $19.96 | 0.5% |
| Odessa, TX | 330 | $15.37 | $31,960 | $14.43 | $16.55 | -11.8% |
| Ogden-Clearfield, UT | 2380 | $16.03 | $33,330 | $13.94 | $17.44 | -8.0% |
| Oklahoma City, OK | 5600 | $14.90 | $31,000 | $13.81 | $16.21 | -14.4% |
| Olympia-Tumwater, WA | 950 | $20.08 | $41,760 | $17.83 | $22.34 | 15.3% |
| Omaha-Council Bluffs, NE-IA | 6840 | $17.53 | $36,450 | $15.25 | $18.34 | 0.6% |
| Orlando-Kissimmee-Sanford, FL | 10700 | $16.41 | $34,130 | $14.20 | $17.71 | -5.8% |
| Oshkosh-Neenah, WI | 660 | $17.23 | $35,840 | $15.33 | $18.97 | -1.0% |
| Owensboro, KY | 560 | $15.72 | $32,700 | $14.65 | $16.34 | -9.7% |
| Oxnard-Thousand Oaks-Ventura, CA | 1720 | $19.82 | $41,230 | $17.77 | $21.19 | 13.8% |
| Palm Bay-Melbourne-Titusville, FL | 2460 | $15.29 | $31,800 | $14.02 | $16.66 | -12.2% |
| Panama City, FL | 670 | $15.58 | $32,410 | $14.05 | $17.04 | -10.5% |
| Parkersburg-Vienna, WV | 430 | $15.16 | $31,530 | $14.32 | $16.69 | -12.9% |
| Pensacola-Ferry Pass-Brent, FL | 2170 | $14.62 | $30,400 | $13.35 | $15.31 | -16.1% |
| Peoria, IL | 3050 | $16.47 | $34,250 | $15.29 | $17.08 | -5.4% |
| Philadelphia-Camden-Wilmington, PA-NJ-DE-MD | 32440 | $18.17 | $37,780 | $16.98 | $19.71 | 4.3% |
| Phoenix-Mesa-Scottsdale, AZ | 11200 | $18.44 | $38,350 | $17.34 | $19.49 | 5.9% |
| Pine Bluff, AR | 440 | $13.92 | $28,960 | $12.89 | $15.05 | -20.0% |
| Pittsburgh, PA | 11340 | $17.51 | $36,430 | $16.90 | $18.36 | 0.6% |
| Pittsfield, MA | 510 | $18.15 | $37,760 | $16.91 | $18.22 | 4.3% |
| Pocatello, ID | 370 | $15.52 | $32,280 | $13.95 | $16.19 | -10.9% |
| Port St. Lucie, FL | 1840 | $15.18 | $31,580 | $14.01 | $16.56 | -12.8% |
| Portland-South Portland, ME | 2340 | $19.17 | $39,870 | $17.43 | $21.19 | 10.1% |
| Portland-Vancouver-Hillsboro, OR-WA | 7480 | $21.15 | $44,000 | $18.41 | $23.31 | 21.5% |
| Portsmouth, NH-ME | 840 | $19.12 | $39,770 | $17.87 | $20.67 | 9.8% |
| Prescott, AZ | 510 | $18.42 | $38,310 | $17.16 | $19.76 | 5.8% |
| Providence-Warwick, RI-MA | 9830 | $18.87 | $39,250 | $17.00 | $20.49 | 8.4% |
| Provo-Orem, UT | 1730 | $15.59 | $32,430 | $13.71 | $17.17 | -10.5% |
| Pueblo, CO | 740 | $17.49 | $36,370 | $15.94 | $18.12 | 0.4% |
| Punta Gorda, FL | 810 | $15.72 | $32,710 | $14.33 | $16.80 | -9.7% |
| Racine, WI | 630 | $17.53 | $36,450 | $15.58 | $18.44 | 0.6% |
| Raleigh, NC | 5270 | $16.03 | $33,340 | $13.84 | $17.88 | -8.0% |
| Rapid City, SD | 860 | $15.72 | $32,690 | $14.06 | $17.54 | -9.7% |
| Reading, PA | 1740 | $17.38 | $36,140 | $16.99 | $17.94 | -0.2% |
| Redding, CA | 580 | $18.47 | $38,410 | $17.41 | $18.65 | 6.0% |
| Reno, NV | 1180 | $19.69 | $40,960 | $16.37 | $21.45 | 13.1% |
| Richmond, VA | 6280 | $15.79 | $32,850 | $14.20 | $17.48 | -9.3% |
| Riverside-San Bernardino-Ontario, CA | 8460 | $19.12 | $39,770 | $17.53 | $20.25 | 9.8% |
| Roanoke, VA | 2140 | $15.19 | $31,600 | $13.78 | $16.62 | -12.8% |
| Rochester, MN | 970 | $19.09 | $39,710 | $17.48 | $20.62 | 9.6% |
| Rochester, NY | 5090 | $17.92 | $37,270 | $15.50 | $19.10 | 2.9% |
| Rockford, IL | 1550 | $16.72 | $34,770 | $15.58 | $17.16 | -4.0% |
| Rocky Mount, NC | 790 | $14.07 | $29,260 | $12.29 | $16.73 | -19.2% |
| Rome, GA | 880 | $14.13 | $29,400 | $12.94 | $14.34 | -18.8% |
| Sacramento--Roseville--Arden-Arcade, CA | 5090 | $21.17 | $44,040 | $18.27 | $22.29 | 21.6% |
| Saginaw, MI | 1370 | $16.21 | $33,720 | $15.23 | $17.89 | -6.9% |
| Salem, OR | 1270 | $21.59 | $44,900 | $18.27 | $23.87 | 24.0% |
| Salinas, CA | 910 | $20.72 | $43,100 | $18.68 | $22.01 | 19.0% |
| Salisbury, MD-DE | 1820 | $16.87 | $35,080 | $15.77 | $17.59 | -3.1% |
| Salt Lake City, UT | 5640 | $16.66 | $34,650 | $14.73 | $18.01 | -4.3% |
| San Angelo, TX | 430 | $14.14 | $29,420 | $13.49 | $14.33 | -18.8% |
| San Antonio-New Braunfels, TX | 6890 | $15.47 | $32,180 | $14.08 | $16.72 | -11.2% |
| San Diego-Carlsbad, CA | 9290 | $20.39 | $42,420 | $18.18 | $21.83 | 17.1% |
| San Francisco-Oakland-Hayward, CA | 10980 | $25.13 | $52,280 | $21.56 | $28.32 | 44.3% |
| San Jose-Sunnyvale-Santa Clara, CA | 5230 | $24.81 | $51,600 | $21.70 | $27.36 | 42.5% |
| San Juan-Carolina-Caguas, PR | 430 | $11.27 | $23,450 | $8.51 | $10.61 | -35.3% |
| San Luis Obispo-Paso Robles-Arroyo Grande, CA | 570 | $19.25 | $40,030 | $17.70 | $20.73 | 10.5% |
| Santa Cruz-Watsonville, CA | 370 | $21.36 | $44,440 | $18.43 | $22.71 | 22.7% |
| Santa Fe, NM | 270 | $17.88 | $37,190 | $15.75 | $18.50 | 2.7% |
| Santa Maria-Santa Barbara, CA | 1050 | $20.25 | $42,120 | $17.92 | $22.23 | 16.3% |
| Santa Rosa, CA | 1050 | $20.99 | $43,660 | $18.95 | $21.69 | 20.5% |
| Savannah, GA | 1560 | $14.89 | $30,960 | $13.28 | $16.52 | -14.5% |
| Scranton--Wilkes-Barre--Hazleton, PA | 2810 | $16.67 | $34,670 | $15.38 | $17.52 | -4.3% |
| Seattle-Tacoma-Bellevue, WA | 15890 | $21.40 | $44,520 | $19.20 | $22.43 | 22.9% |
| Sebastian-Vero Beach, FL | 890 | $15.84 | $32,940 | $14.52 | $17.37 | -9.1% |
| Sebring, FL | 560 | $14.40 | $29,950 | $12.99 | $16.36 | -17.3% |
| Sheboygan, WI | 480 | $17.57 | $36,540 | $16.77 | $18.53 | 0.9% |
| Sherman-Denison, TX | 400 | $14.44 | $30,030 | $13.45 | $15.14 | -17.1% |
| Shreveport-Bossier City, LA | 2030 | $14.95 | $31,100 | $12.74 | $15.48 | -14.1% |
| Sierra Vista-Douglas, AZ | 190 | $17.07 | $35,510 | $16.75 | $17.72 | -2.0% |
| Sioux City, IA-NE-SD | 990 | $16.83 | $35,000 | $15.51 | $17.53 | -3.4% |
| Sioux Falls, SD | 2450 | $15.47 | $32,170 | $14.76 | $17.04 | -11.2% |
| South Bend-Mishawaka, IN-MI | 1440 | $16.24 | $33,790 | $14.92 | $17.60 | -6.7% |
| Spartanburg, SC | 1430 | $16.30 | $33,900 | $14.55 | $18.38 | -6.4% |
| Spokane-Spokane Valley, WA | 2500 | $18.58 | $38,640 | $17.03 | $19.36 | 6.7% |
| Springfield, IL | 1140 | $17.22 | $35,810 | $15.73 | $17.80 | -1.1% |
| Springfield, MA-CT | 3900 | $18.61 | $38,710 | $17.04 | $19.28 | 6.9% |
| Springfield, MO | 2420 | $15.04 | $31,290 | $13.82 | $16.75 | -13.6% |
| Springfield, OH | 610 | $15.80 | $32,860 | $14.39 | $17.01 | -9.3% |
| St. Cloud, MN | 1360 | $17.66 | $36,730 | $15.58 | $19.70 | 1.4% |
| St. George, UT | 1140 | $15.36 | $31,940 | $13.97 | $16.27 | -11.8% |
| St. Joseph, MO-KS | 490 | $16.23 | $33,750 | $14.02 | $17.35 | -6.8% |
| St. Louis, MO-IL | 12870 | $16.41 | $34,140 | $14.55 | $17.39 | -5.7% |
| State College, PA | 490 | $16.88 | $35,110 | $14.83 | $18.06 | -3.1% |
| Staunton-Waynesboro, VA | 620 | $15.77 | $32,790 | $13.97 | $18.81 | -9.5% |
| Stockton-Lodi, CA | 2110 | $19.71 | $40,990 | $17.97 | $21.36 | 13.2% |
| Sumter, SC | 400 | $14.92 | $31,040 | $13.61 | $16.36 | -14.3% |
| Syracuse, NY | 2880 | $17.80 | $37,020 | $15.21 | $19.24 | 2.2% |
| Tallahassee, FL | 1450 | $13.62 | $28,320 | $11.97 | $14.96 | -21.8% |
| Tampa-St. Petersburg-Clearwater, FL | 15420 | $16.72 | $34,770 | $14.74 | $17.94 | -4.0% |
| Terre Haute, IN | 730 | $15.42 | $32,080 | $13.65 | $16.97 | -11.4% |
| Texarkana, TX-AR | 700 | $14.13 | $29,390 | $13.00 | $14.96 | -18.9% |
| The Villages, FL | 490 | $15.01 | $31,210 | $13.40 | $16.38 | -13.8% |
| Toledo, OH | 3280 | $16.43 | $34,170 | $14.57 | $17.52 | -5.7% |
| Topeka, KS | 1980 | $16.10 | $33,490 | $14.35 | $16.98 | -7.5% |
| Trenton, NJ | 1670 | $17.81 | $37,040 | $16.33 | $19.55 | 2.3% |
| Tucson, AZ | 2810 | $17.25 | $35,870 | $15.44 | $18.05 | -1.0% |
| Tulsa, OK | 4290 | $15.05 | $31,300 | $14.09 | $16.25 | -13.6% |
| Tuscaloosa, AL | 1070 | $14.13 | $29,380 | $11.91 | $15.75 | -18.9% |
| Twin Falls, ID | 500 | $16.36 | $34,020 | $14.34 | $17.25 | -6.1% |
| Tyler, TX | 1520 | $14.27 | $29,690 | $13.60 | $14.43 | -18.0% |
| Urban Honolulu, HI | 3460 | $19.29 | $40,130 | $16.33 | $21.80 | 10.8% |
| Utica-Rome, NY | 1360 | $16.90 | $35,160 | $14.80 | $17.86 | -2.9% |
| Valdosta, GA | 700 | $13.33 | $27,720 | $10.82 | $14.25 | -23.5% |
| Vallejo-Fairfield, CA | 980 | $20.76 | $43,180 | $18.02 | $21.99 | 19.2% |
| Victoria, TX | 470 | $14.15 | $29,430 | $13.15 | $15.07 | -18.7% |
| Vineland-Bridgeton, NJ | 750 | $18.23 | $37,910 | $16.98 | $20.23 | 4.7% |
| Virginia Beach-Norfolk-Newport News, VA-NC | 7120 | $15.13 | $31,470 | $13.64 | $16.83 | -13.1% |
| Visalia-Porterville, CA | 1190 | $18.62 | $38,720 | $16.77 | $18.24 | 6.9% |
| Waco, TX | 1090 | $15.09 | $31,390 | $13.57 | $16.16 | -13.3% |
| Walla Walla, WA | 360 | $18.71 | $38,910 | $17.46 | $18.92 | 7.4% |
| Warner Robins, GA | 690 | $14.26 | $29,660 | $11.26 | $17.39 | -18.1% |
| Washington-Arlington-Alexandria, DC-VA-MD-WV | 21980 | $18.33 | $38,120 | $16.31 | $19.91 | 5.2% |
| Waterbury, CT | 900 | $17.99 | $37,410 | $16.69 | $19.60 | 3.3% |
| Waterloo-Cedar Falls, IA | 1170 | $16.91 | $35,180 | $15.20 | $18.11 | -2.9% |
| Watertown-Fort Drum, NY | 240 | $16.08 | $33,450 | $14.19 | $16.78 | -7.6% |
| Wausau, WI | 450 | $16.86 | $35,070 | $16.26 | $17.90 | -3.2% |
| Weirton-Steubenville, WV-OH | 520 | $15.22 | $31,660 | $13.99 | $17.40 | -12.6% |
| Wenatchee, WA | 400 | $17.87 | $37,170 | $15.09 | $18.83 | 2.6% |
| Wheeling, WV-OH | 860 | $15.10 | $31,400 | $14.05 | $16.92 | -13.3% |
| Wichita Falls, TX | 750 | $14.70 | $30,570 | $12.98 | $17.82 | -15.6% |
| Wichita, KS | 4240 | $15.61 | $32,470 | $13.97 | $16.95 | -10.4% |
| Williamsport, PA | 690 | $16.42 | $34,160 | $15.04 | $17.50 | -5.7% |
| Wilmington, NC | 1670 | $14.86 | $30,920 | $13.34 | $17.19 | -14.6% |
| Winchester, VA-WV | 620 | $15.87 | $33,010 | $14.45 | $16.78 | -8.9% |
| Winston-Salem, NC | 3850 | $15.34 | $31,900 | $14.00 | $17.26 | -11.9% |
| Worcester, MA-CT | 4040 | $18.71 | $38,920 | $17.77 | $19.17 | 7.5% |
| Yakima, WA | 1050 | $18.62 | $38,730 | $17.50 | $19.11 | 6.9% |
| York-Hanover, PA | 1600 | $17.11 | $35,590 | $16.95 | $17.62 | -1.7% |
| Youngstown-Warren-Boardman, OH-PA | 2450 | $15.16 | $31,530 | $13.93 | $16.53 | -12.9% |
| Yuba City, CA | 470 | $19.07 | $39,670 | $17.77 | $19.13 | 9.5% |
| Yuma, AZ | 440 | $16.41 | $34,130 | $15.04 | $17.36 | -5.8% |
Other factors that impact a CNA’s pay
While job location is one of the biggest factors in how much a CNA gets paid, it’s certainly not the only one. Let’s take a look at some of the other key contributing factors to how much a CNA makes.
Highest paying industries for CNAs
Many new CNAs make the mistake of taking the first job offer they get. This can be a costly mistake. While there are many available CNA jobs at nursing homes and long and short-term care facilities, there may be higher-paying jobs at more specialized facilities.
For a more specific answer to the question, “How much do CNAs get paid?” you’ll need to take a deeper look into the various industries that require Certified Nursing Assistants. As you can see in the table below, taking a job as a CNA in scientific research pays, on average, almost $16,000 more annually compared to a CNA working in home health care.
| Industry | Hourly average wage | Annual average wage |
|---|---|---|
| Junior Colleges | $33.25 | $69,150 |
| Scientific Research and Development Services | $23.09 | $48,020 |
| Technical and Trade Schools | $24.17 | $50,270 |
| Specialty (except Psychiatric and Substance Abuse) Hospitals | $18.64 | $38,780 |
| General Medical and Surgical Hospitals | $18.18 | $37,820 |
| Employment Services | $19.44 | $40,430 |
| Nursing Care Facilities (Skilled Nursing Facilities) | $16.90 | $35,160 |
| Continuing Care Retirement Communities and Assisted Living Facilities for the Elderly | $16.41 | $34,130 |
| Home Health Care Services | $15.46 | $32,160 |
| Dentist Offices | $26.86 | $55,870 |
| Colleges and Universities | $23.95 | $49,820 |
Source: Bureau of Labor and Statistics
More experience and education equals greater pay
As with most jobs, the more experience and education a person has can lead to higher wages. This holds true for nursing assistants. According to data from Payscale, experience has a direct impact on how much CNAs are paid. Salary data from over 37,000 CNAs shows the following expected increases in pay from each stage of a CNAs career.
| CNA Experience Level | Expected Salary Increase |
|---|---|
| Entry Level: less than 1 year | - |
| Early Career: 1-4 years | 3.9% |
| Mid Career: 5-9 years | 4.9% |
| Late Career: 10-19 years | 3.8% |
| Experienced: 20+ years | 3.7% |
Source: Payscale.com
While it can take years of experience to see big increases in pay from gaining experience, a quicker route for CNAs to improve their average pay is through education and specialization. CNAs that have specialized skills have greater employment opportunities and can typically demand better wages and benefits. Data from paysale.com dictates the following five skills as having the greatest positive impact on a nursing aide’s salary.
- Cardiology
- Advanced Cardiac Life Support
- Critical Care
- Microsoft Excel
- Typing
In terms of specializations, some of the most popular CNA specializations that attract higher salaries include:
- Pediatrics Aide
- Geriatrics Aide
- Cardiology Aide
- Psychiatry Aide
Some of these positions may require special certifications. Others may only need relevant experience in a facility catering to a certain type of patient. CNAs early in their career would be wise to gain extra certifications and specialized experience to improve their long-term job and salary potential.
Some CNAs use their position as a starting point in a larger healthcare career. Moving beyond a nursing assistant role, CNAs may then pursue broader nurse education options, including two and four-year programs that can offer other lucrative job opportunities.
- Licensed Practical Nurse (LPN)
- Registered Nurse (RN)
- Travel Nurse
How does CNA pay compare to other medical jobs like LPNs and RNs?
There are many different jobs and job titles in the healthcare world that make for interesting salary comparisons for CNAs. Registered Nurses (RNs) and Licensed Practical Nurses (LPNs) require much more formal education and certification for their positions. Therefore, it’s unsurprising that they tend to make a fair bit more than CNAs. As a point of comparison, the list below covers average salaries for some other healthcare positions according to the Bureau of Labor Statistics in comparison to a CNA’s salary.
| Job Title | Annual Salary | vs. CNA Salary |
|---|---|---|
| Home Health and Personal Care Aides | $30,930 | -14.61% |
| Certified Nursing Assistant | $36,220 | - |
| Medical Transcriptionist | $37,090 | 2.40% |
| Pharmacy Technician | $40,260 | 11.15% |
| Phlebotomist | $40,580 | 12.04% |
| Medical Assistant | $40,700 | 12.37% |
| Emergency Medical Technicians and Paramedics | $45,000 | 24.24% |
| LPN and LVN | $55,860 | 54.22% |
| Cardiovascular Technologist | $65,490 | 80.81% |
| Occupational Therapy Assistant | $66,280 | 82.99% |
| Dietitian / Nutritionist | $69,350 | 91.47% |
| Registered Nurse | $89,010 | 145.75% |
| Occupational Therapist | $92,800 | 156.21% |
| Physical Therapist | $97,960 | 170.46% |
Common career paths: The CNA career ladder
Many CNAs may stay in the role for a decade or more. Other CNAs use their position and their experience in patient care to transition to other healthcare jobs. With the increased pay scale for other nursing roles, many CNAs use their position to gain experience on their way to becoming LPNs or RNs.
- Learn more about how a CNA becomes an LPN or becomes an RN.
The most popular careers that CNAs eventually move into include:
- Registered Nurse
- Family Nurse Practitioner (NP)
- Licensed Practical Nurse
- Medical Assistant
- Certified Medical Assistant
- Certified Nurse’s Aide
- Nursing Home Administrator
- Geriatric Care Manager
Zippia has a detailed CNA Career Path Map that has a lot of information on CNA jobs and career progression that’s worth reviewing if you want to see where a career as a CNA could take you.
Additional compensation and job benefits for CNAs
While a steady paycheck is nice, many CNA jobs come with additional benefits. These benefits can make a major difference in total compensation, too. In some cases, benefits packages can increase pay by up to 25 percent. Full-time CNA positions come with a benefits package that can include holidays, paid vacation, vision, dental, and health insurance. Additional perks offered by some employers may include tuition reimbursement and retirement contributions.
Make more with overtime and shift differentials
Another way in which CNAs can earn additional compensation is if they choose to work overtime or if their place of work offers multiple shift options. If the healthcare or long-term care facility that a CNA works at offers extended hours or 24-hour care, selecting evening, overnight, or holiday shifts may be a path to earning more. While each place of employment is different, a CNA may make 50% more working an evening or on-call shift than a normal daytime shift.
Where can I find open CNA positions?
There are a huge number of online resources that can help job hunters find CNA job openings. We’ve created a search engine that aggregates results from several job websites. You can try our CNA job search tool and run a search like “CNA Austin, TX” and it will search several major job sites for results at once.
The overall demand for CNAs across the U.S. in the next 3-10 years is expected to grow. While a Google search may also unearth some opportunities both locally and nationally, the following links provide quick access to search job openings for CNAs and can be filtered to help you find jobs in whichever location you choose.
- CNA job search @ cnaclassesnearme.com
- Indeed
- mycnajobs.com
- Monster
- Snagajob
- ZipRecruiter
- SimplyHired
Interested in becoming a CNA?
This site provides many resources to help you learn more about what it takes to become a CNA and prepare for the CNA written exam and skills test. Follow the links below to learn more.